
Server Guides
Knowing before your customers do
The worst way to learn your site is down is a message from a customer. Monitoring is just the set of things that tell you first, and for a single offshore VPS you need far less of it than the enterprise tooling market would suggest.
Two things do most of the work: something outside your network checking the site is up, and something inside telling you when a resource is running out. Everything else is refinement.
Watching from outside
Start here, because monitoring that runs on the server cannot tell you the server is unreachable. If the box is off, so is your monitoring.
Use a free external service such as UptimeRobot, BetterStack or Hetrix. Point it at a real page rather than the homepage, and have it check for a string that only appears when the site is working properly. A homepage that returns 200 while the database is down is still a broken site, and a plain ping check will happily call that healthy.
Set the interval to one minute if the free plan allows it, and send alerts somewhere you will actually see them. Email at 3am is not that. Telegram or a phone push is.
The four commands
When something feels slow, these four answer nearly every question in about ten seconds.
uptime
free -h
df -h
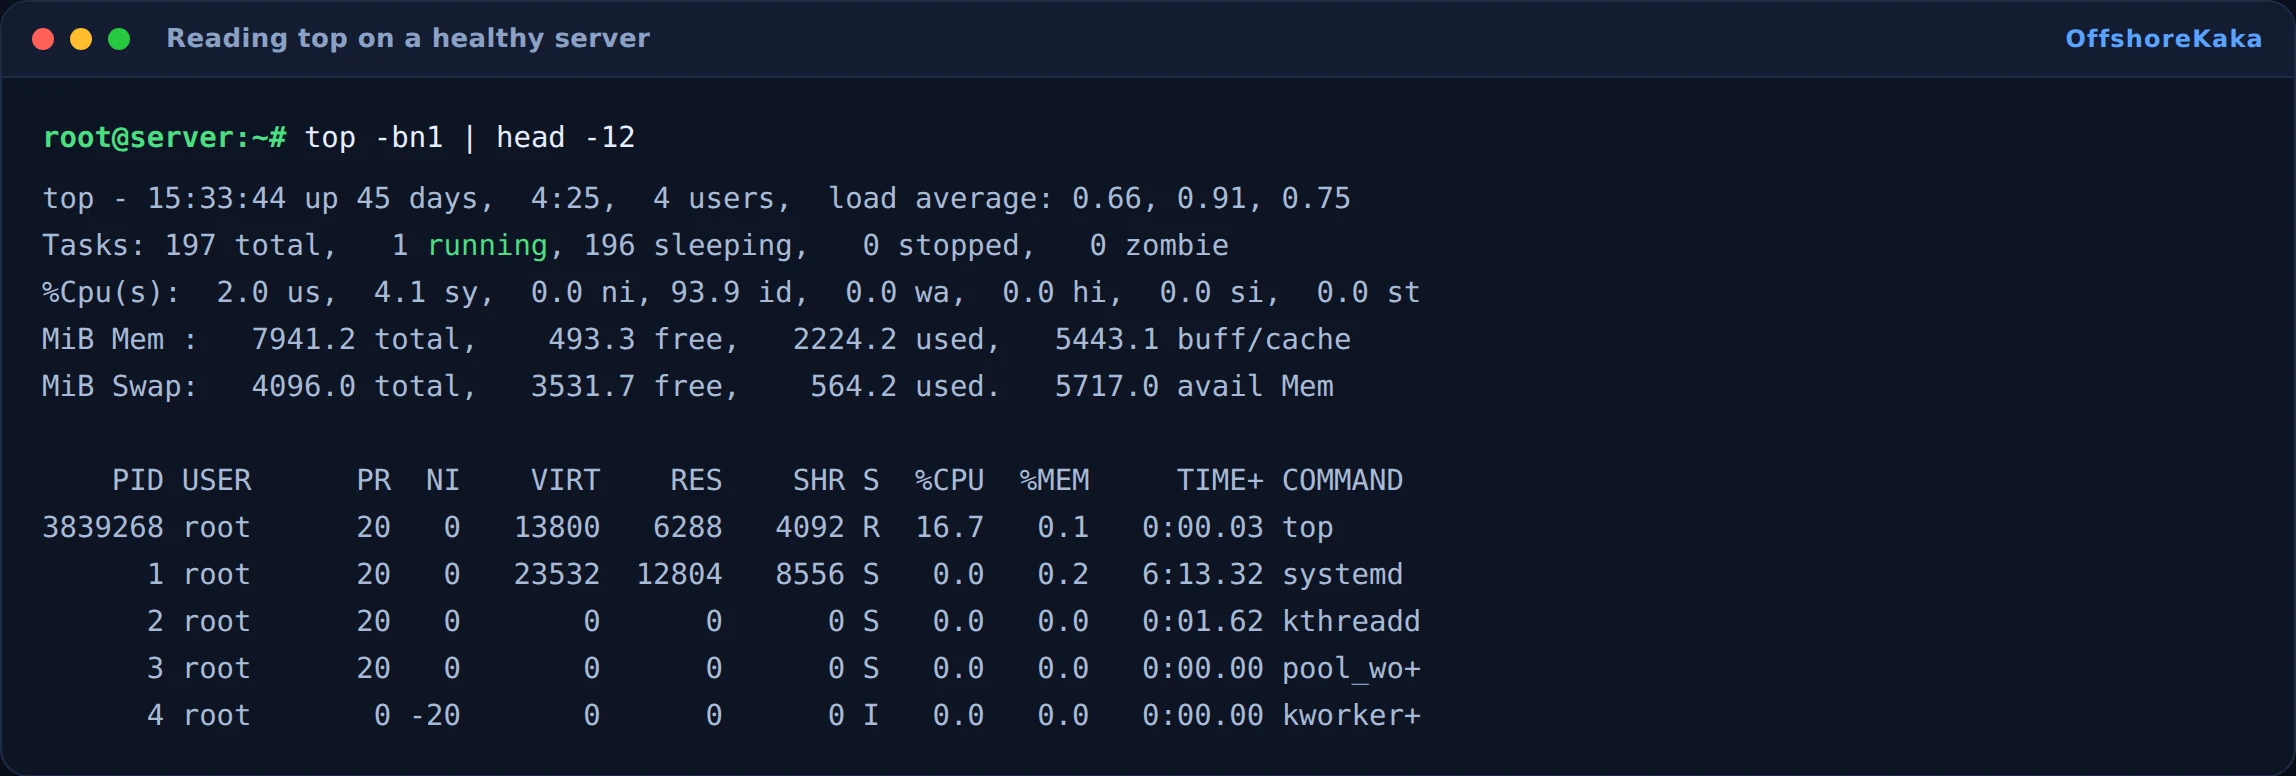
top -bn1 | head -12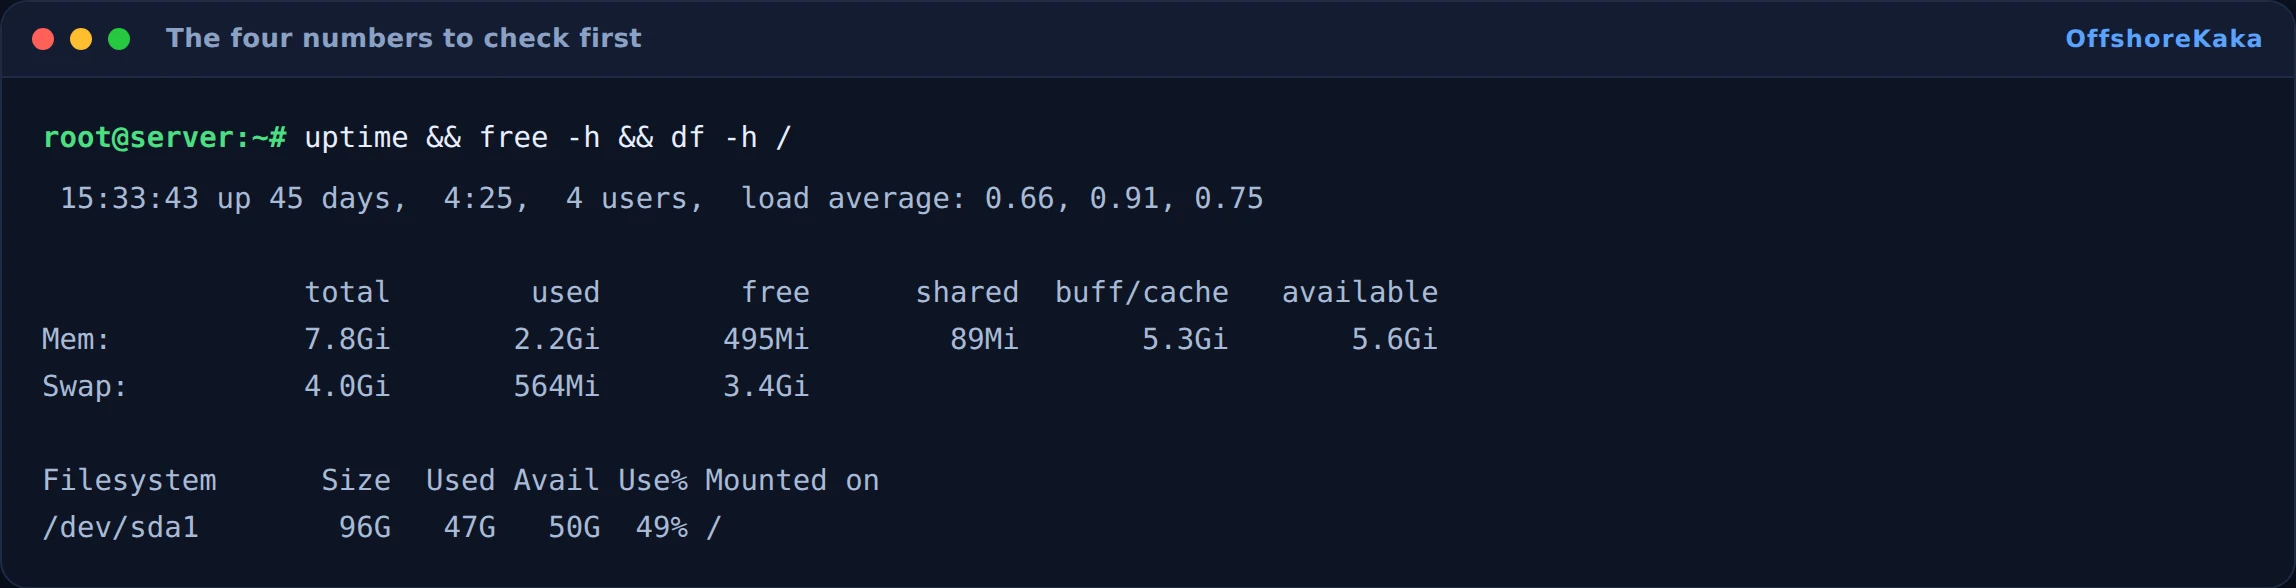
How to read it:
- Load average. The three numbers are one, five and fifteen minute averages. Compare against your core count. On a 4 core box, a load of 4 means fully busy, and 12 means badly overloaded. On a 1 core box, 4 is already trouble.
- Memory. Ignore the free column, it will always look small. Look at available, which counts cache the system can reclaim. If available is near zero and swap is filling, you have a real memory problem.
- Disk. Anything over 85 percent needs attention this week. At 100 percent, MySQL stops accepting writes and the site starts throwing errors that look like anything except a full disk.
A live dashboard
Netdata gives you per second graphs of everything, and installs in one command:
wget -O /tmp/netdata-kickstart.sh https://my-netdata.io/kickstart.sh
sh /tmp/netdata-kickstart.sh
It listens on port 19999. Do not open that port to the internet. It exposes a lot about your server and has no authentication of its own. Either restrict it to your own IP:
ufw allow from 203.0.113.5 to any port 19999 proto tcpOr leave the port closed and tunnel to it over SSH when you need it, which is cleaner:
ssh -L 19999:localhost:19999 deployer@your-server-ipThen open http://localhost:19999 in your browser. Nothing is exposed and you get the full dashboard.
One caveat on a small VPS. Netdata collects a lot by default and on a 1GB box that overhead is noticeable. Reduce the collectors, or skip it and rely on the four commands plus external monitoring.
Reading the logs
tail -f /var/log/nginx/error.logRun that in one window while you reproduce the problem in a browser. Errors appear as they happen, which beats guessing.
For finding what is generating traffic, the access log tells you quickly:
awk '{print $1}' /var/log/nginx/access.log | sort | uniq -c | sort -rn | head
awk '{print $7}' /var/log/nginx/access.log | sort | uniq -c | sort -rn | head
The first gives you the busiest IP addresses, the second the busiest URLs. If one IP has ten thousand requests and everyone else has twenty, you have found your load problem. If /xmlrpc.php is at the top of the second list, you are being brute forced.
Keep an eye on log size too. An error log that grows to gigabytes will fill the disk and take the site down, which we have seen more than once.
What to alert on
Alert on a handful of things and act on all of them. Alert on twenty and you will start ignoring the lot.
- Site unreachable for two consecutive checks. One failed check is usually a network blip.
- Backup job failed. Silent backup failure is the most expensive thing on this list. See the backup guide for the log format that makes this easy to alert on.
- Disk above 85 percent. The single most valuable alert on this list.
- Load above twice your core count for more than five minutes.
- Available memory under 10 percent with swap in use.
- TLS certificate expiring within 14 days. Auto renewal fails quietly more often than you would like.
That last one is worth a manual check now and then. Our SSL guide covers reading the expiry from the command line.
How to test the monitoring works
- Stop nginx for thirty seconds and confirm you get an alert. Untested monitoring is a guess.
- Check the alert reaches your phone, not just an inbox.
- Fill a scratch file to push disk usage over the threshold, confirm the alert, then delete it.
- Confirm the external monitor is checking a real page and matching on content.
- Look at the dashboard while the site is healthy, so you know what normal looks like.
That last point matters more than it sounds. Baselines are what let you tell “busy” from “broken”.
When something breaks
| What you see | Why | Fix |
|---|---|---|
| Constant false alerts | Check interval too tight, or alerting on a single failed check | Require two consecutive failures |
| Netdata not reachable | Port 19999 closed, which is correct | Use the SSH tunnel rather than opening it |
| Load high but CPU mostly idle | Processes waiting on disk. Look at wa in top | Find the slow query or the runaway backup job |
| Memory looks full on an idle server | Reading free instead of available | Use the available column |
| Disk filled overnight | A log or a backup with no retention | du -sh /var/log/* | sort -h to find it, then add rotation |
| Monitoring says up, users say down | The check only pings, or only fetches the homepage | Check an inner page and match on page content |
Checklist
- External monitor checking a real page with content matching.
- Alerts going somewhere you will see at night.
- Alert fires on two failed checks, not one.
- Disk usage alert set at 85 percent.
- Netdata bound to localhost or restricted to your IP.
- Log rotation on, so logs cannot fill the disk.
- The whole thing tested by deliberately breaking something.
Want a server you can see into?
OffshoreKaka VPS plans come with full root access and resource graphs in the panel, so you can watch CPU, memory and bandwidth without installing anything.
FAQ
Do I need external monitoring if I have Netdata?
Yes. Netdata runs on the server. If the server is off, the network is down, or the datacentre has a problem, Netdata is off too and cannot tell you anything. The external check is the one that catches a total outage.
Does monitoring slow the server down?
External checks cost nothing measurable. Netdata does use some CPU and memory, noticeably so on a 1GB VPS. Trim the collectors or leave it off on the smallest plans.
How long should I keep logs?
Two weeks of access logs and a month of error logs suits most sites. Compress anything older. Logrotate handles this and is already installed on most distributions.
Does uptime affect SEO?
Indirectly. Google will not penalise a brief outage, but if the crawler keeps hitting a dead server it slows down crawling, and repeated long outages do eventually cost you. Users leaving because the site was down is the bigger cost.