
Server Guides
What TTFB actually is
Time to First Byte is how long the browser waits after asking for a page before the first byte of the answer arrives. It covers the DNS lookup, the TCP connection, the TLS handshake, and then however long your server takes to build the page.
That last part is usually the whole problem. People move their site to an offshore host, see a slow number, and blame the distance. Distance costs you tens of milliseconds. A slow WordPress query costs you hundreds. This guide shows you how to tell which one you are actually dealing with.
Measure it properly
Do not use a browser devtools number as your baseline. It includes your own connection, your extensions and your browser cache. Use curl, which measures one clean request:
curl -o /dev/null -s -w 'ttfb: %{time_starttransfer}sntotal: %{time_total}sn' https://yourdomain.com/Run it three times. The first one includes a DNS lookup that the next two will not, so the first number is always worse and always misleading.
Split the number up
A single TTFB number tells you almost nothing. Break it into its parts and the culprit becomes obvious:
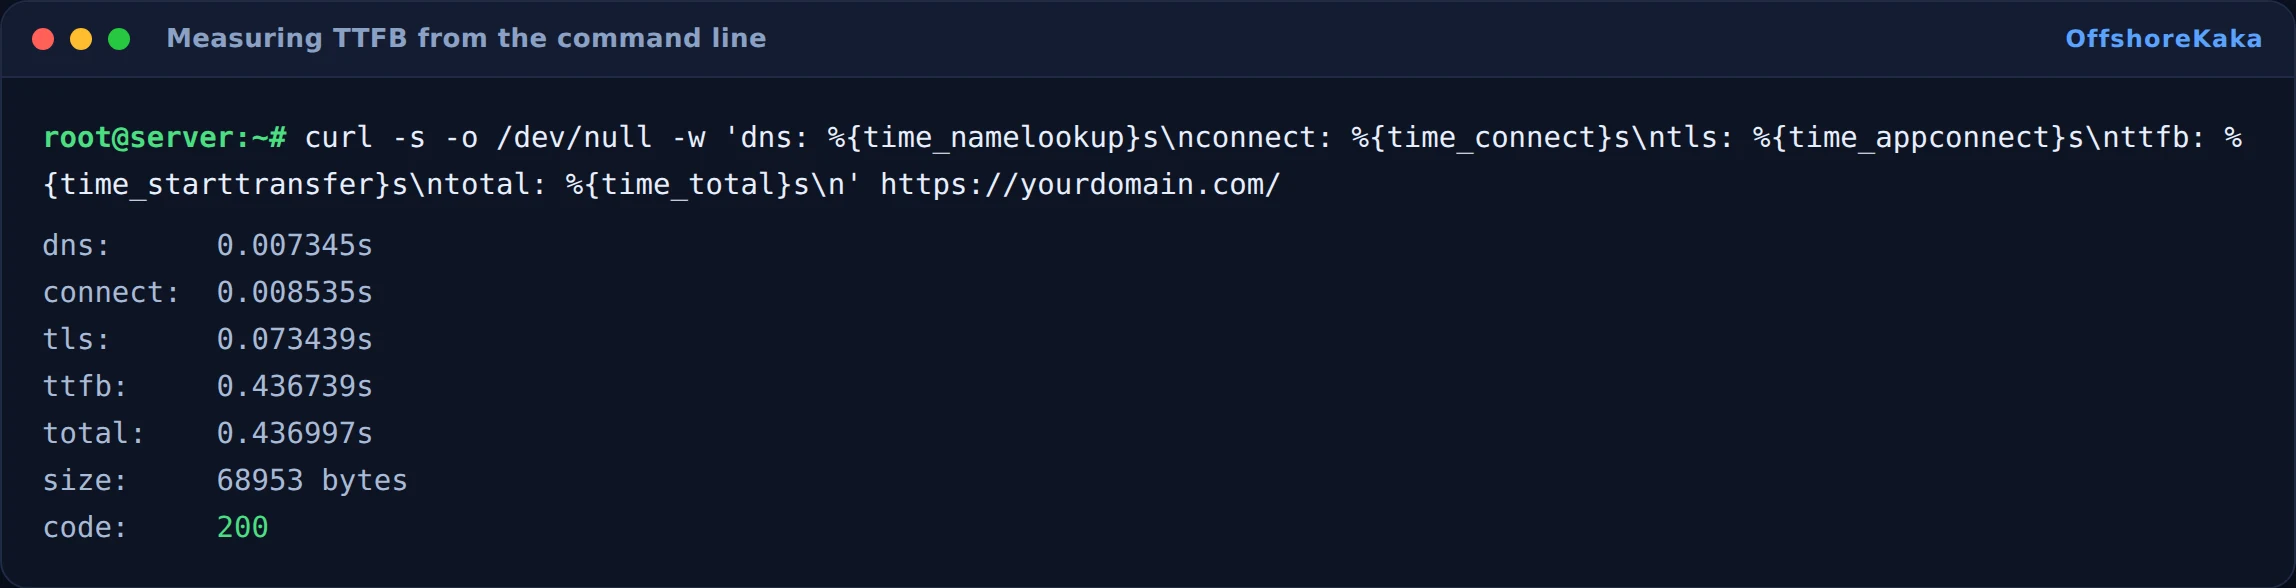
Read it like this:
- dns high, over 100ms: slow DNS provider. Moving to Cloudflare or another anycast provider fixes it once and for good.
- connect minus dns: raw network latency to the server. This is the part distance actually controls, and from Europe to a European datacentre it should be well under 50ms.
- tls minus connect: the handshake. Should be small. If it is large, the server is probably not doing TLS session resumption or is still on HTTP/1.1.
- ttfb minus tls: this is your application. On the sample above it is by far the biggest slice, and that is the normal picture on an uncached WordPress site.
If that last gap is 300ms or more, no CDN and no server move will save you. Fix the application first.
Page caching
This is the single biggest change you can make, and it is usually the difference between 600ms and 40ms. Without a cache, every visitor makes WordPress boot PHP, load plugins, run dozens of database queries and render a template. With one, the server hands over a file it already built.
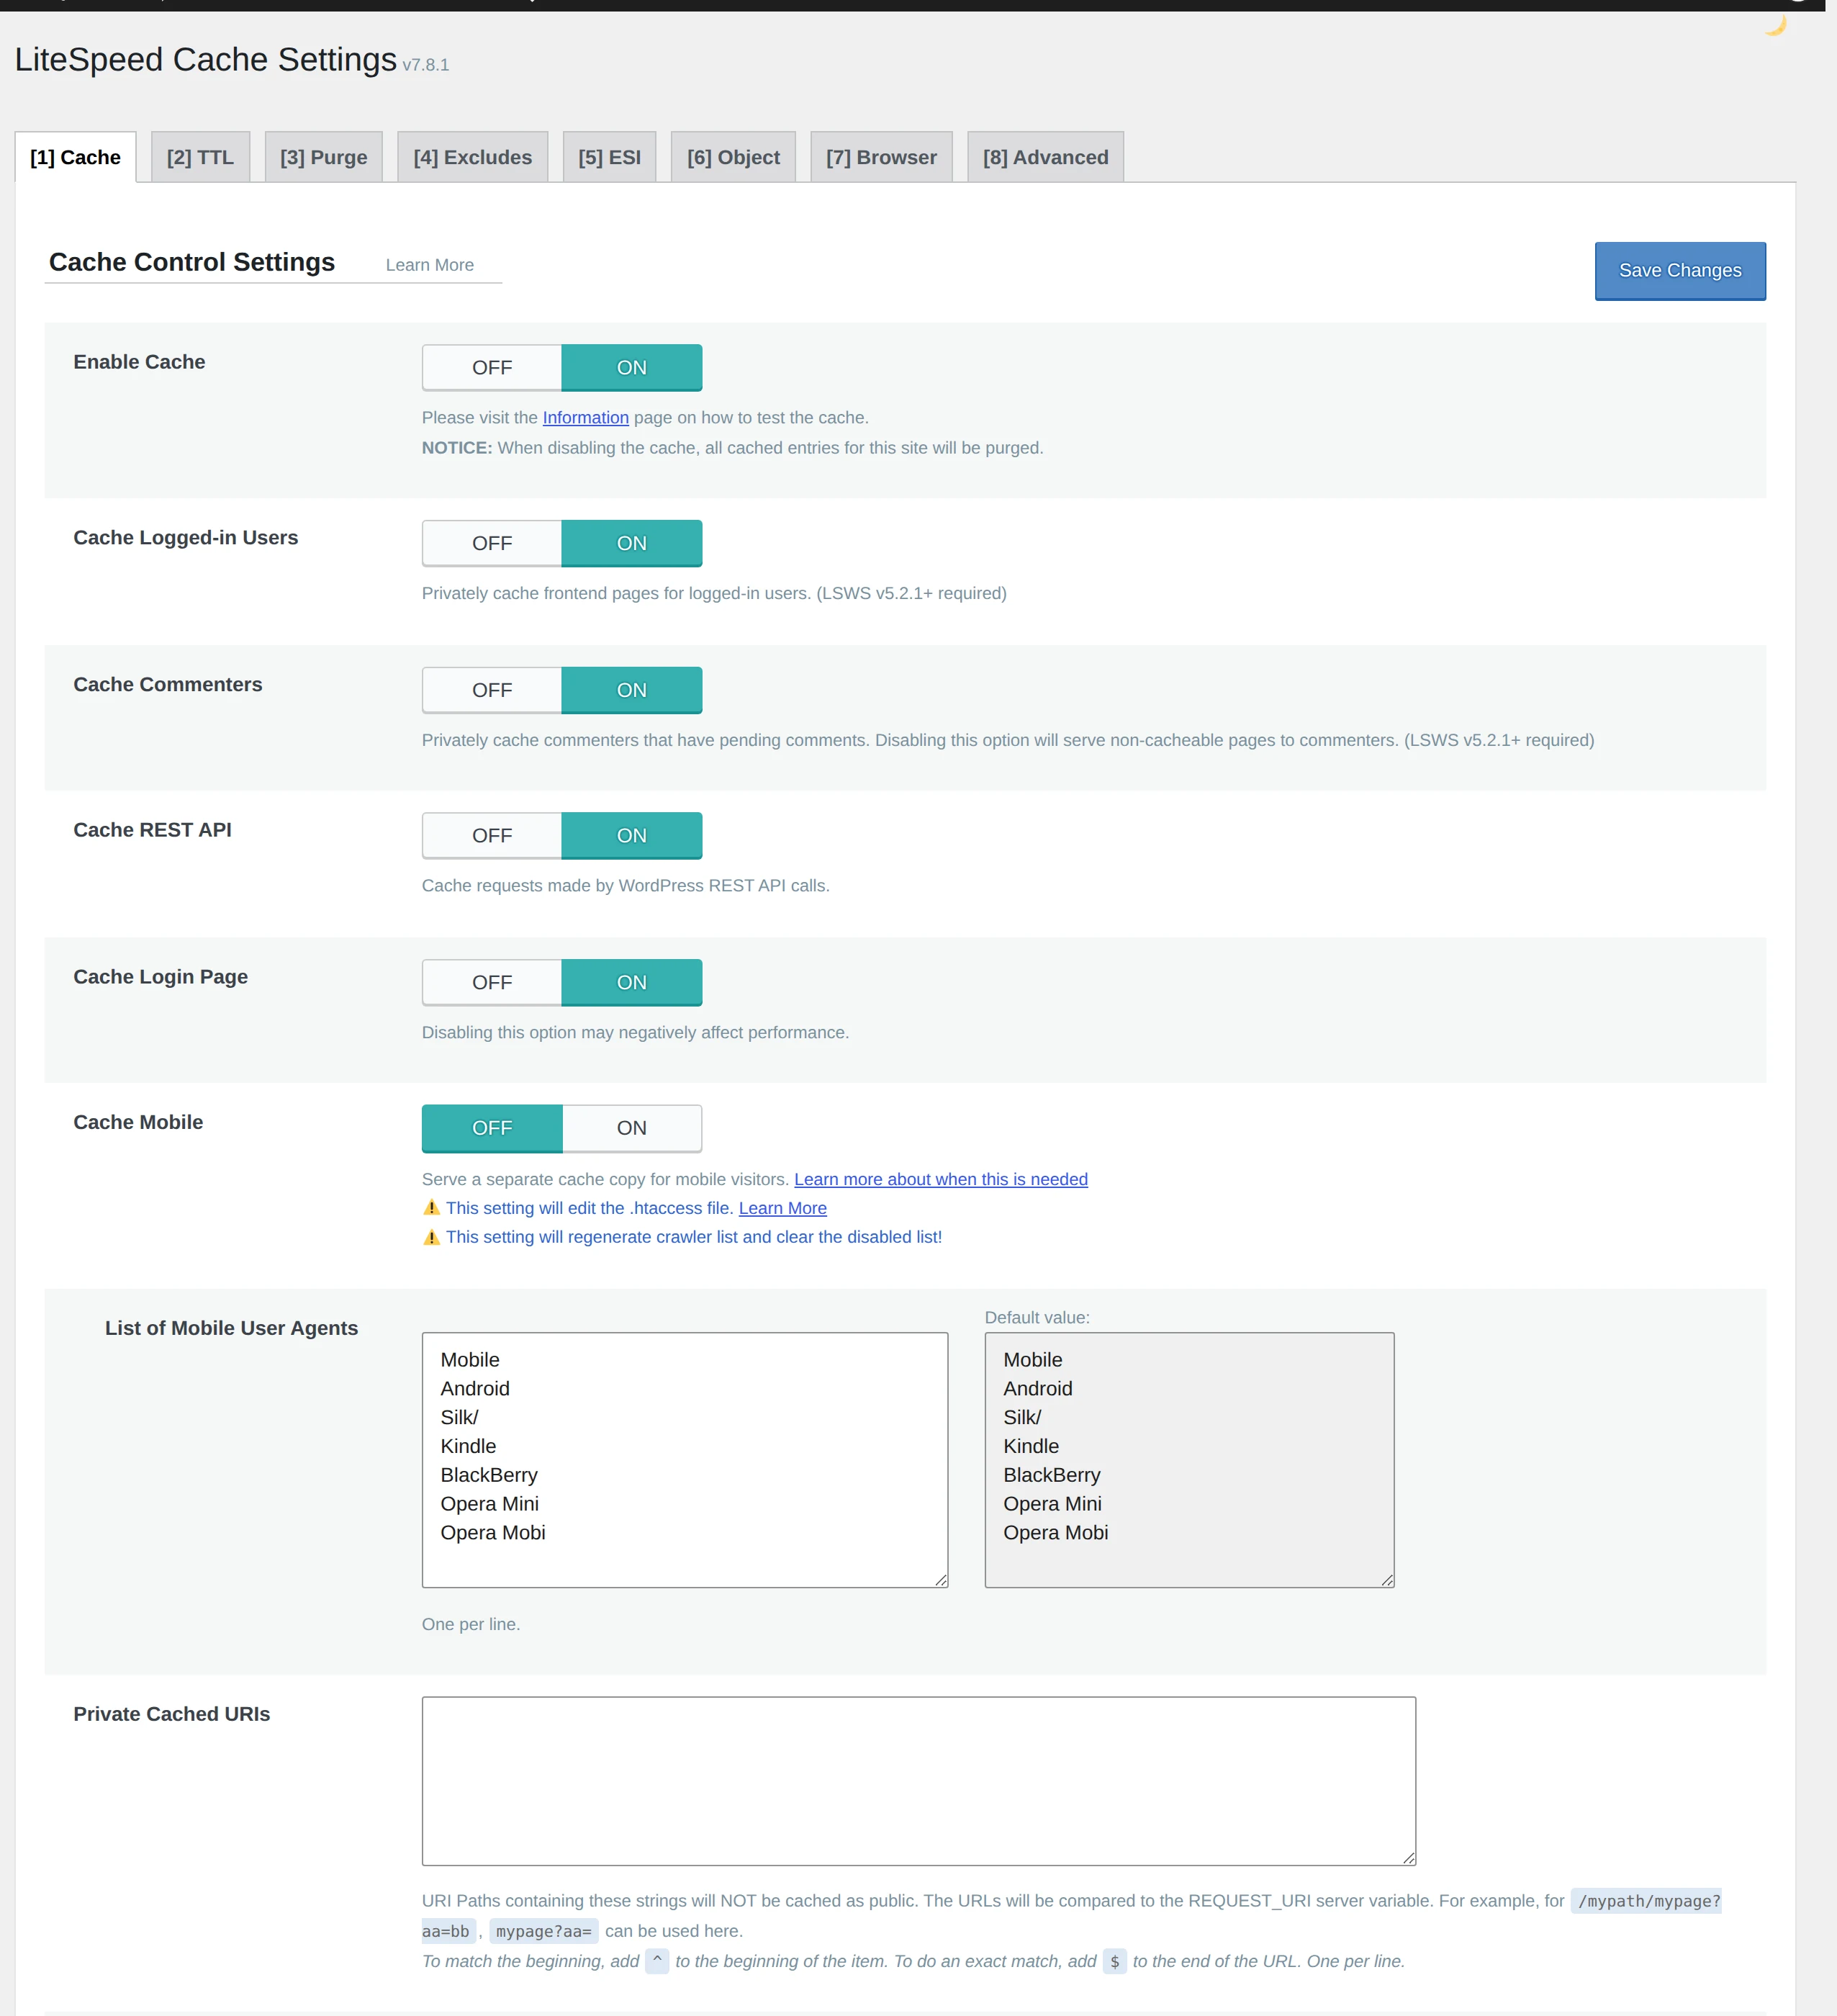
On LiteSpeed, install LiteSpeed Cache and turn it on. On nginx, use a page cache plugin or fastcgi_cache. On Apache, WP Super Cache or W3 Total Cache.
Then verify it is actually working, because a cache plugin that is installed but not caching is extremely common:
curl -sI https://yourdomain.com/ | grep -Ei 'x-litespeed-cache|cf-cache-status|x-cache'
Two things stop caches working that people miss for weeks. A logged-in session bypasses the cache by design, so always test in a private window. And a plugin that sets a cookie on every visitor, which many chat and analytics plugins do, makes every request look unique and defeats the cache entirely.
PHP and the database
Caching handles anonymous visitors. Logged-in users, checkout pages and search results cannot be cached, so the uncached speed still matters.
OPcache keeps compiled PHP in memory instead of recompiling every file on every request. It is free and typically cuts PHP time by a third:
php -i | grep -E 'opcache.enable|opcache.memory_consumption'If it says Off, enable it in your PHP ini and restart PHP-FPM. Give it 128MB on a normal site. One caveat worth knowing: WordPress runs fine with OPcache, but a few applications do not, so check before enabling it on a shared box running several things.
PHP version. Moving from 7.4 to 8.3 is a real speed gain, often 20 percent or more, for no work beyond testing your plugins.
The database is where most remaining slowness lives. On WordPress, the usual suspects are an wp_options table stuffed with autoloaded data, and expired transients that were never cleaned up. Check the autoload size:
SELECT ROUND(SUM(LENGTH(option_value))/1024/1024, 2) AS mb
FROM wp_options WHERE autoload = 'yes';
Under 1MB is healthy. Over 3MB and every single page load is dragging that through memory before it renders anything.
Where a CDN helps, and where it does not
A CDN caches your files at locations near your visitors. For images, CSS and JavaScript it is a clear win and you should use one.
For TTFB on the HTML itself, it depends entirely on whether the CDN caches your HTML. By default Cloudflare does not cache HTML on the free plan, so an HTML request still travels to your origin and your TTFB is your origin plus a small routing overhead. Setting a cache rule for HTML changes that, but you have to be careful not to cache logged-in or cart pages.
Compression is worth checking while you are there, since it costs nothing:

Our Cloudflare setup guide covers getting the DNS side right first.
How to test properly
- Run curl three times and use the second or third number.
- Test in a private window, not logged in.
- Test the homepage and an inner page. They often behave differently.
- Confirm the cache header says HIT on the second request.
- Compare against the origin directly, bypassing the CDN, to see what your server alone is doing.
- Retest from a location close to your real audience, not just from your own desk.
When something breaks
| What you see | Why | Fix |
|---|---|---|
| TTFB fine for you, slow for visitors | You are hitting a nearby edge, they are not | Test from their region, and check origin latency separately |
| Cache header always says MISS | A cookie is being set on every request, or you are logged in | Test privately, then find the plugin setting the cookie |
| First request slow, rest fast | Normal cache warming | Ignore it, or pre-warm from the sitemap |
| Fast HTML, slow page | TTFB is fine, the front end is heavy | Different problem. Look at image sizes and blocking scripts |
| Speed dropped after a plugin update | New queries or a new external call on every request | Disable it and measure again to confirm |
| Random slow requests only | Cron running on page load, or a noisy neighbour | Move WP cron to a real cron job, then check server load |
Checklist
- Measured with curl, not the browser, and not on the first run.
- Timing split into DNS, connect, TLS and application.
- Page cache on, and verified with a HIT header.
- OPcache enabled and PHP on a current version.
- Autoloaded options under 1MB.
- Compression confirmed in the response headers.
- Retested from a location near your actual audience.
Want the server side to stop being the bottleneck?
OffshoreKaka runs LiteSpeed with LSCache on NVMe in Amsterdam and Frankfurt, so cached pages are served in milliseconds.
FAQ
What counts as a good TTFB?
Under 200ms is genuinely fast. Between 200 and 500ms is fine and nobody will notice. Above 800ms people start feeling it. Google’s own guidance treats 800ms as the point where server response time becomes a problem worth flagging.
Does offshore hosting mean a worse TTFB?
Only by the physics of distance, which is tens of milliseconds, not hundreds. A well-tuned server in Amsterdam beats a badly tuned one down the road every time. If your audience is European, offshore hosting in the Netherlands or Germany is not a handicap at all.
Which single change helps most?
Page caching. It usually takes more off the number than every other item on this page put together, and it takes ten minutes.
Will a faster TTFB improve my ranking?
It helps a little and it is measured, but it is not a big lever. Speed is a tiebreaker between pages that are otherwise similar. It will not lift a weak page above a strong one. Fix it because visitors leave slow sites, and treat the SEO part as a bonus. If your site keeps going down, our monitoring guide is a better use of the same hour.